1. ClearQuant — Teaching Philosophy
A defensive trading bot is aligned with the student profile: structured individuals who want to understand how trading works before taking action.
ClearQuant Learning Path
| Level | Content | Bot's Role |
|---|---|---|
| Beginners | Understand basic indicators and make first decisions | Reference model: the bot teaches its own strategy |
| Intermediate | Identify the bot's strengths and limitations | Discussion support with the AI coach or the ClearQuant community |
| Advanced | Formalize an improved strategy, learn to backtest it scientifically | Comparison base: backtest your own strategy within the same rigorous framework |
Key Metrics
2. Methodology
- Train (2023-09-26 → 2024-10-10): optimization via Optuna (452 trials). Rather than relying solely on raw return to select the best parameterization, we chose this scoring formula: score = Sharpe × (1 − MaxDD) × regime_consistency. 400-candle warmup to initialize indicators.
- OOS Validation (2024-06-19 → 2024-10-24): 4 out-of-sample months, first GO/NO-GO for deployment.
- Extended Test (2024-10-24 → 2026-03-26): 17 months including two institutional bull phases, an ATH2 at $126k USD, and a severe correction. True robustness test.
• Sharpe: quality of risk-adjusted return. High Sharpe = consistent gains with low volatility.
• (1 − MaxDD): penalizes configurations that let drawdown exceed a threshold. Rewards capital preservation.
• regime_consistency: bonus if the bot performs in all 3 regimes (bull, lateral, correction). Prevents overfitting on the bull — the dominant regime in training.
Identified limitations: this bot was optimized on a single training window. No walk-forward or Monte Carlo has been performed at this stage — these methods remain in the backlog. Slippage is approximate (fixed 0.1% fee model). Results do not guarantee future performance.
3. Context: Bitcoin's Institutional Era
| Date | Event | BTC Price | Period | Impact |
|---|---|---|---|---|
| 11 Jan. 2024 | BTC Spot ETF Approval (BlackRock, Fidelity, Invesco...) | $46,647 | Train | Massive institutional flows, volatility −55%. Bot impact: fixed Hurst window measures a weaker persistence signal → Hurst oscillates between MR/TF regimes in low volatility. Paradoxically, reduced volatility destabilizes the strategy. |
| 05 Nov. 2024 | Trump Election — pro-crypto policy | ~$69,000 | Test | Acceleration: BTC ×1.6 in 45 days |
| 17 Dec. 2024 | ATH1 — first all-time high | $108,320 | Test | +57% rally in 6 weeks since the election |
| 20 Jan. 2025 | Trump Inauguration / ATH1b | $109,350 | Test | Peak of the first institutional phase |
| 06 Oct. 2025 | ATH2 — new all-time high | $126,210 | Test | Second bull phase, then correction |
Three distinct eras: (1) Pre-ETF — retail 24/7 market, high volatility, globally dispersed movements. (2) Post-ETF (Jan. 2024, end of training) — first institutional flows, volatility down 55%, market starting to concentrate on US hours. (3) Post-Trump inauguration (Jan. 2025, test) — full institutional maturity: majority of volume during US hours, more directional movements, less susceptible to mean reversion.
The bot was optimized during the transition — it saw the first weeks of the institutional era (early Jan. 2024 at end of training) but not its full expression (Jan. 2025 onward, in test). In the current bot version, the fixed Hurst window, calibrated to detect trends in a volatile retail market, is not automatically recalibrated when the reference volatility shifts. This logical thread explains the declining test results compared to the Training and Validation periods.
4. Training Results (In-Sample) — 2023-09-26 → 2024-10-10
| Metric | Bot | Buy & Hold | Delta |
|---|---|---|---|
| Cumulative Return | +125.38% | +130.10% | -4.72% |
| Sharpe ratio (annualized) | 1.91 | 1.85 | +0.056 |
| Maximum Drawdown | -27.16% | -32.31% | -5.1pp |
| Trades executed (bot) | 1555 | — | — |
| Upside Capture Ratio (UCR) | 96.4% | 100% | -3.6pp vs parity |
Reading the results: The V4 optimization score = Sharpe × (1 − MaxDD) rewards quality of risk-adjusted return, not its absolute level. The bot therefore sacrificed 4.7pp of return in exchange for a higher Sharpe and better-controlled MaxDD. The UCR of 96.4% confirms that participation in BTC movement is near-total.
5. Out-of-Sample Validation — 2024-06-19 → 2024-10-24
| Métrique | Bot | Buy & Hold | Delta |
|---|---|---|---|
| Cumulative Return | +10.85% | +3.52% | +7.33% |
| Sharpe ratio (annualized) | 0.89 | 0.45 | +0.443 |
| Maximum Drawdown | -23.00% | -28.65% | -5.6pp |
| Trades executed (bot) | 557 | — | — |
Performance by Regime in Validation
The selected configuration is the only one to maintain a positive composite score in all 3 market regimes present in validation — thanks to the regime_consistency criterion of the optimization function.
| Regime | Hurst | % of Time | Bot Return (approx.) |
|---|---|---|---|
| Mean Reversion (MR) | Anti-persistent | 7.4% | +12.24% |
| Trend Following (TF) | Persistent | 88.3% | +9.60% |
| Neutral Zone (HOLD) | ~0.5 | 4.3% | +13.91% |
Approximate returns calculated over the time ranges of each regime.
6. Extended Test — Oct 2024 → Mar 2026
| Métrique | Bot | Buy & Hold | Delta |
|---|---|---|---|
| Cumulative Return | -2.78% | +5.74% | -8.52% |
| Sharpe ratio (annualized) | 0.12 | 0.32 | -0.198 |
| Maximum Drawdown | -40.85% | -50.08% | -9.2pp |
| Trades executed (bot) | 1701 | — | — |
These contrasting results call for a more detailed analysis by market type.
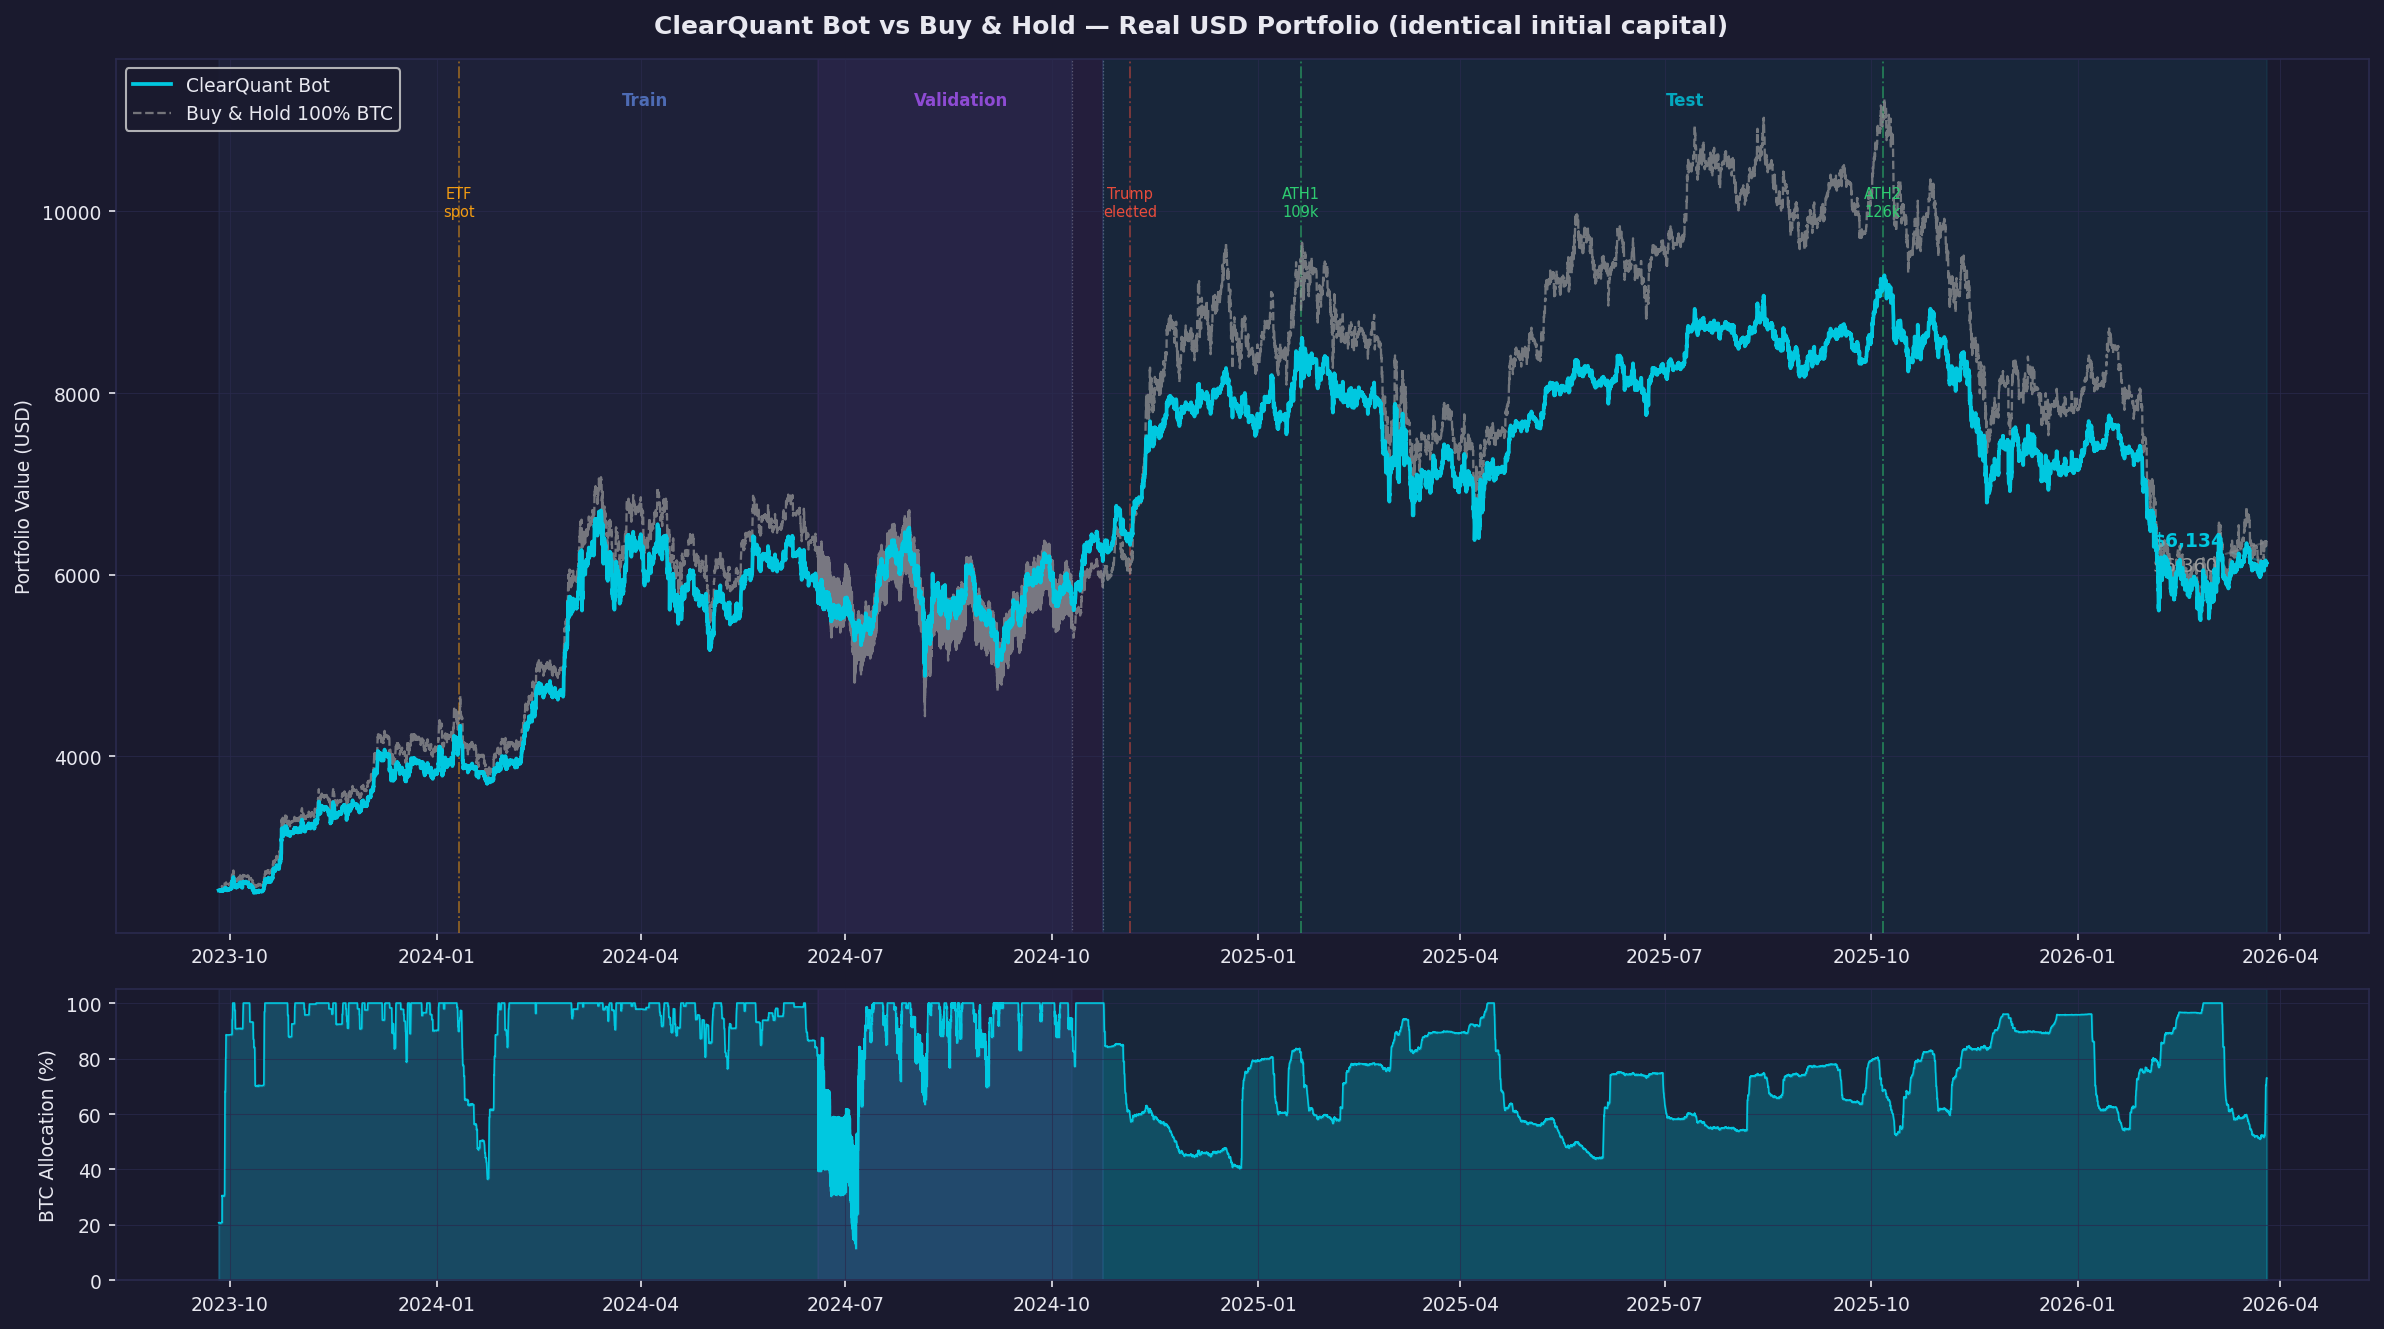
Fig. 1 — Equity curves: Bot vs Buy & Hold over 3 consecutive periods. Click the buttons to annotate key phases.
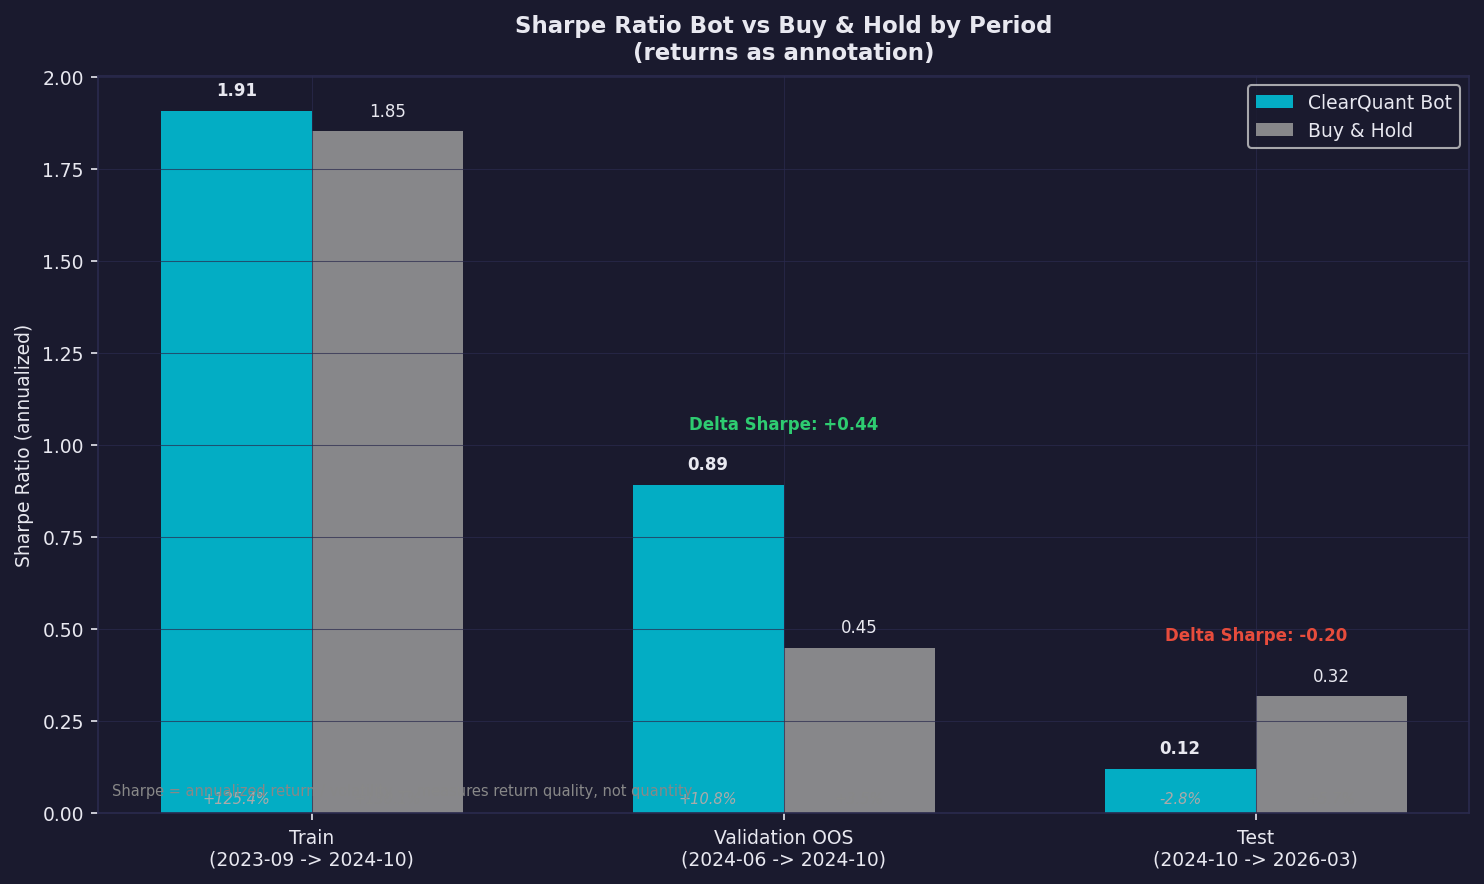
Fig. 3 — Cumulative return by period with annotated alpha and UCR
Analysis of Fig. 1 — Bot Behavior by Phase
Training and Validation (2023-09 → 2024-10): The bot correctly follows downward corrections and upward trends. Capital protection during the correction (Jul. 2024: BTC −21%) and trend-following during the bull phase are illustrated on the equity curves.
The November 2024 Test: The test starts in line with validation (~100% BTC). Yet it only captures a fraction of the +44% bull (67k→97k). The cause: the Hurst exponent oscillates between 0.47 and 0.55, the retail→institutional transition zone — neither clearly MR nor clearly TF. The bot defaults to Mean Reversion mode. In MR mode, the logic is: short SMA > long SMA = recent price above long-term average = overvaluation signal → SELL. Every BTC rise is interpreted as an imminent reversion to the mean. This is a poor calibration for this context.
Christmas Recovery (Dec. 2024): The −11% correction (106k→94k) triggers a BUY signal in MR mode. Allocation rises quickly and the bot captures the end of ATH1 (99k→109k) at 70-80% exposure.
ATH2 (Aug–Oct. 2025): The bot remains between 65-80% allocation. Unlike training, where high-confidence signals depleted USD (BTC allocation near 100%), the institutional market generates more nuanced signals. Trades are smaller, allocation stays close to the 65% LoadBalancer target.
What These Curves Reveal: The Calibration Diagnosis
The bot's main underperformance during the test period stems from a single, identifiable cause: the Hurst calculation window, fixed during Training, is no longer suited to the new post-ETF volatility regime.
Before the institutional era, BTC movements were large and the TF threshold was set relatively high. The bot entered TF mode, followed the trend, and could saturate its allocation. This is the behavior observed in training (10%→100% BTC oscillation, sharp reactivity, UCR 96.4%).
Since the institutional era (volatility reduced by 55%), the same Hurst window generates a weaker persistence signal. The Hurst exponent oscillates around 0.5 — between MR and TF — forcing the bot into its default mode: Mean Reversion. In MR mode, every price rise is interpreted as temporary overvaluation (short SMA > long SMA = recent price above long-term average → SELL). The bot sells BTC during bull phases.
This mismatch is visible in allocation: during training, the bot oscillates between 10% and 100% BTC (clear decisions, readable markets). In test, it oscillates between 40% and 90% (more nuanced — the post-ETF market generates less "extreme" signals for an indicator calibrated on a more volatile era). Conclusion: the current bot underestimates the directionality of the institutional market.
This diagnosis is valuable: it indicates exactly what to correct going forward. The bot's pedagogical validity is not called into question — the current version illustrates precisely this type of problem for students: the need to recalibrate your tools when the market regime changes.
7. Focus: Post-ATH2 Correction (Oct. 2025 → Mar. 2026)
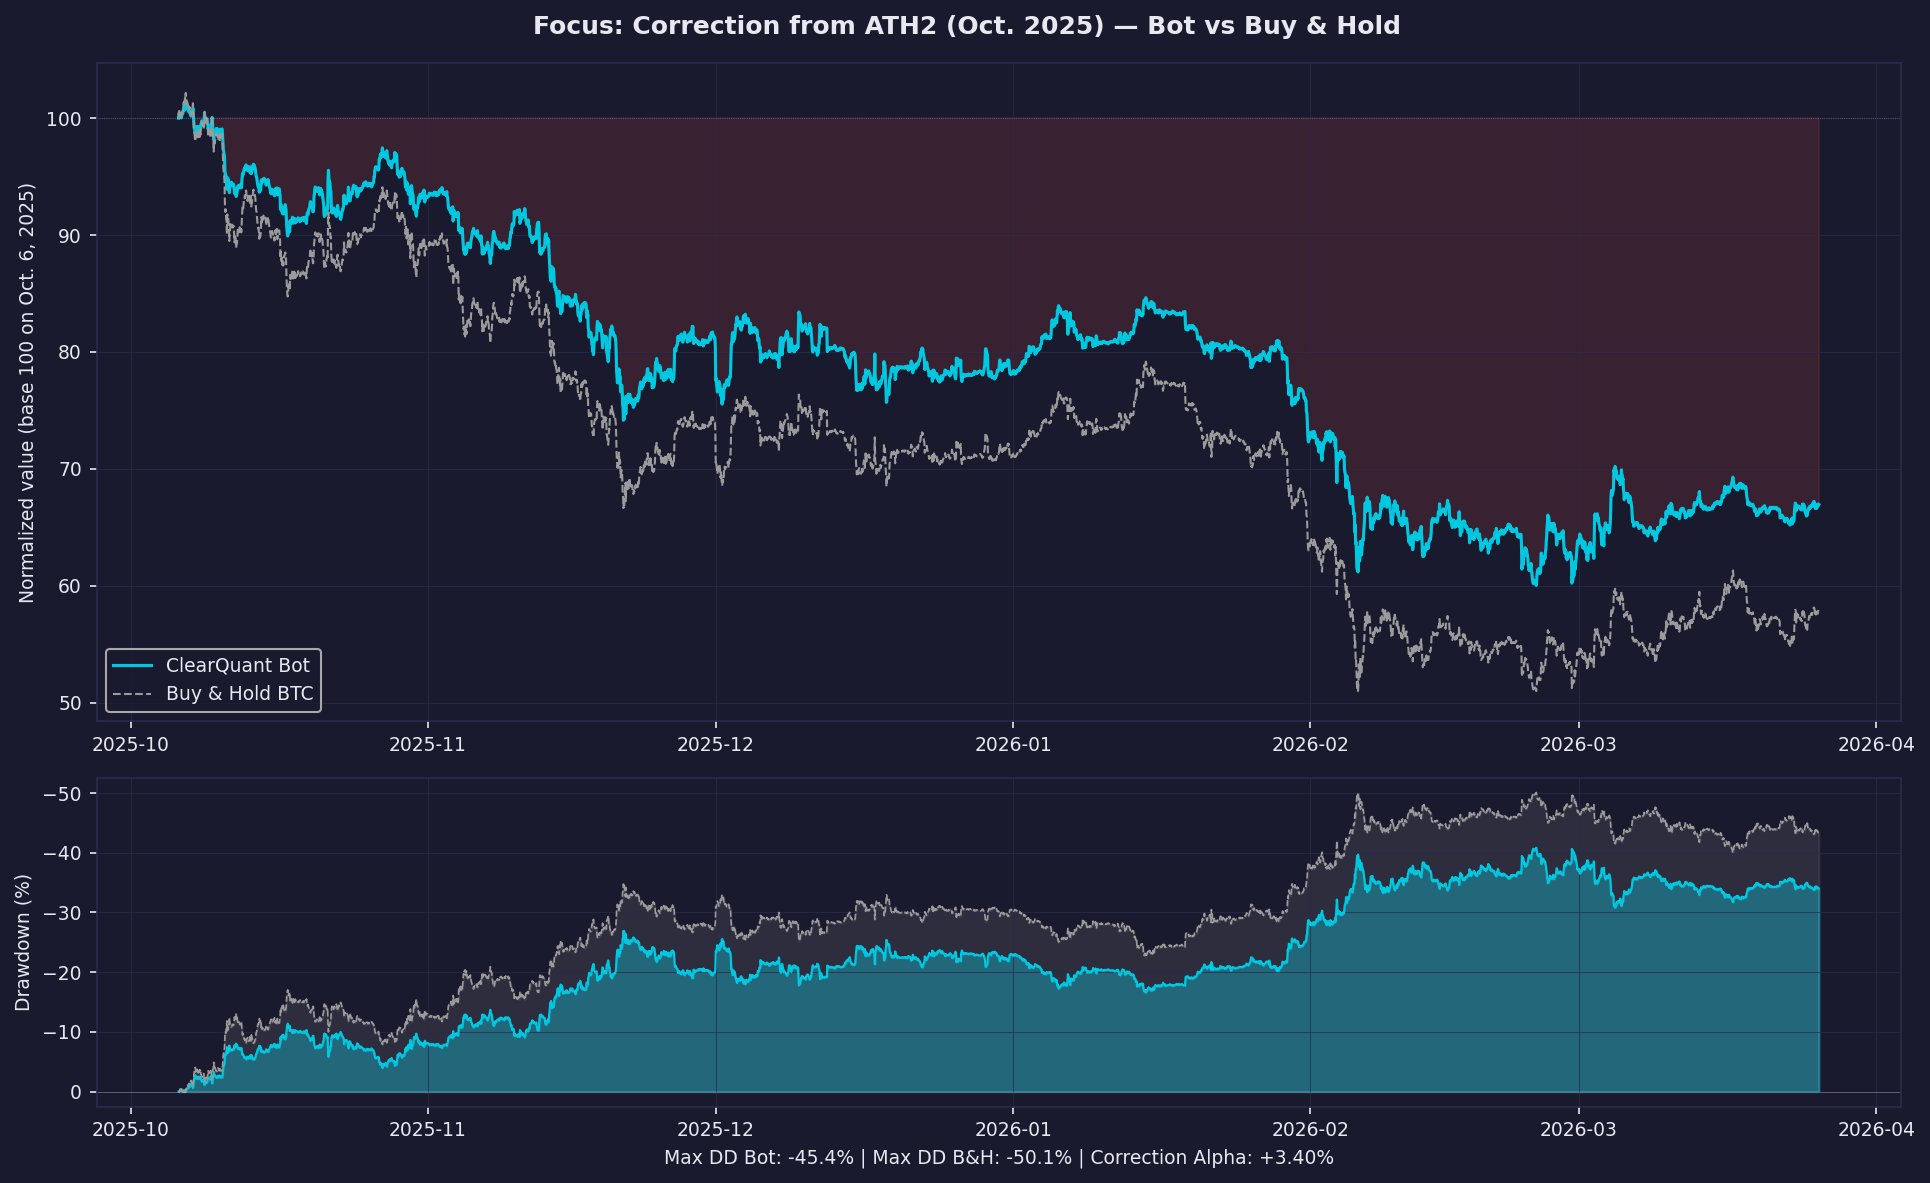
Fig. 5 — Correction since ATH2 (Oct. 2025): equity curve and drawdown bot vs B&H, base 100 at 2025-10-06
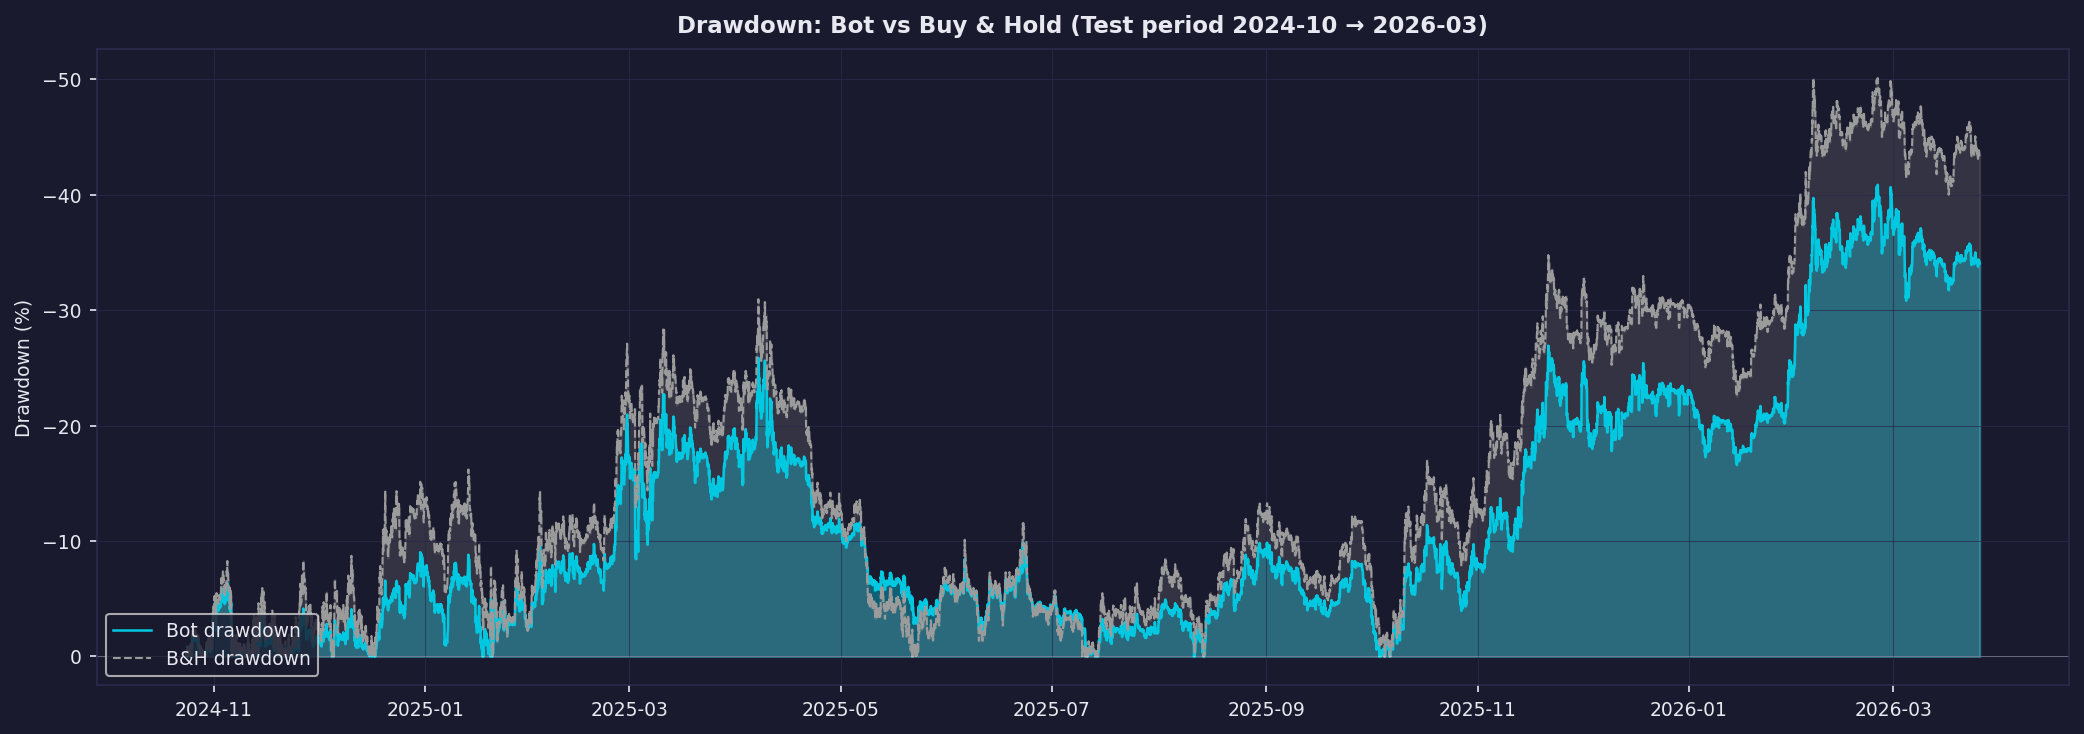
Fig. 2 — Drawdown comparison over the full test (Oct. 2024 → Mar. 2026)
Bot's Active Actions During the Correction
During the drawdown (BTC −44%, ATH2 126k → 71k), the bot operated actively in MR mode:
- Each temporary rebound → SELL signal: in MR mode, a price bounce above the average is interpreted as overvaluation → reduction in BTC exposure.
- Each trough → BUY signal: when price falls back below the long average → undervaluation signal → BTC repurchase.
- Result: The alpha +3.40% (−38.80% vs B&H −42.20%) confirms that this active management outperformed Buy & Hold.
9. Roadmap — Future Versions
V3.0 — Robustness and Execution (2026)
- Limit orders + Stop-Limit: reduce slippage in execution, switch from market orders to limit orders with fallback — direct impact on net return.
- Walk-Forward Analysis: divide training into 5-10 rolling windows and verify that the composite score remains stable. Target: robustness score > 2.0.
- Trailing Stops: in TF mode, let gains run with a dynamic stop. Directly addresses the capture issue identified in section 6.
- Yield Parking: place USDC capital in staking during HOLD periods to generate passive returns on idle capital. The pedagogical value is conditional — include if the program covers passive capital management (staking, yield farming).
V3.5 — Adaptability and Complementary Signals
- Adaptive Hurst (Phase 2D): make Hurst variables (windows, thresholds) dynamic based on observed volatility. Directly addresses the calibration mismatch identified in section 6.
- Multi-lag ACF: enrich the regime signal with autocorrelation across multiple time horizons.
- FRED Macro Filter: integrate the Fed rate, DXY, and other macro indicators to identify institutional risk-on / risk-off periods.
- Fear & Greed + Funding Rate: crypto sentiment signals and futures positioning as confirmation filters.
V4.0 — Multi-Asset (priority if broker partnership)
- Multi-crypto ETH: extend the strategy to ETH/USDT, then to a BTC+ETH basket with dynamic allocation based on each asset's regime.
- Short selling: enable short positions in bearish TF mode — doubles alpha potential during corrections.
- Multi-market (forex, indices, commodities): if a partner broker provides data, apply the Hurst framework to other liquid assets. Natural extension of the model without rewriting the strategy.
V5.0 — Market Structure and Machine Learning
- Structure signals (SMC): integrate Smart Money concepts (Break of Structure, Order Blocks, Fair Value Gaps) as contextual enrichment for TF mode entries — among several possible approaches to refine entries.
- Adaptive ML layer: a lightweight model (gradient boosting) as meta-filter on existing signals, trained on a rolling window to avoid out-of-sample bias.
Priority Axis for V3 — Adaptive Hurst (Phase 2D)
The analysis in section 6 reveals a single, correctable cause: the fixed 132h Hurst window underestimates the directionality of the post-ETF market. The most direct lever is to make this window dynamic based on observed volatility:
| Option | Description | Advantage | Risk |
|---|---|---|---|
| A — Adaptive Hurst (recommended) | Make the Hurst window proportional to realized volatility. BTC vol fell 55% post-ETF: in low vol, widen the window (wider bulls to detect); in high vol, contract it. | Directly addresses the identified calibration mismatch. Phase 2D already in backlog. | Requires partial re-optimization to recalibrate Hurst thresholds. |
| B — Re-optimization on institutional era | Redefine periods: train = Nov. 2024 → Oct. 2025 (12 months min.), val = Nov. 2025 → Mar. 2026. | Captures new institutional behaviors. | Loses useful retail patterns during corrections. Short history (12 months). |
| C — Score including UCR | Add UCR as a component of the optimization score. Rebalances the bot toward more bull capture. | Corrects the defensive bias of the current Sharpe × (1 − MaxDD) score. | May degrade correction protection if poorly weighted. |
| D — Combination A + B + C | Maximum priority if broker partnership (multi-asset, extended resources). | Maximum robustness across all regimes. | Significant re-optimization and validation effort. |
10. Risks and Limitations
- Hurst calibration mismatch: the bot is calibrated on a retail era (2023-2024). The fixed 132h Hurst window underestimates the directionality of post-ETF institutional bulls — this is the primary cause of the negative alpha on the test (see section 6). V3.5 addresses this point.
- No walk-forward: the configuration was optimized on a single training window. Overfitting is possible despite 452 trials. In backlog V3.0.
- Approximate slippage: fees modeled at fixed 0.1%. Real slippage depends on liquidity and the order book. V3.0 (limit orders) reduces this bias.
- Single asset: BTC/USDT only. No cross-asset diversification before V4.0.
- No Monte Carlo: statistical robustness has not been tested by random trade sequence simulation.
11. Conclusion
ClearQuant is not a profit generator — it is a transparent, documented and pedagogical system. Its test period results show negative global alpha, for a precise and correctable reason: it was calibrated for a retail market, then confronted with an institutional market. This diagnosis is useful — it indicates exactly what to improve.
Bot v2.2.0 · BTC/USDT 1h Binance data 2022-06-05 → 2026-03-26 · Generated on 2026-04-07